When biology forces better AI: What protein function prediction taught us about hierarchical data
.png)
By Glenn Kroegel, Senior Machine Learning Engineer
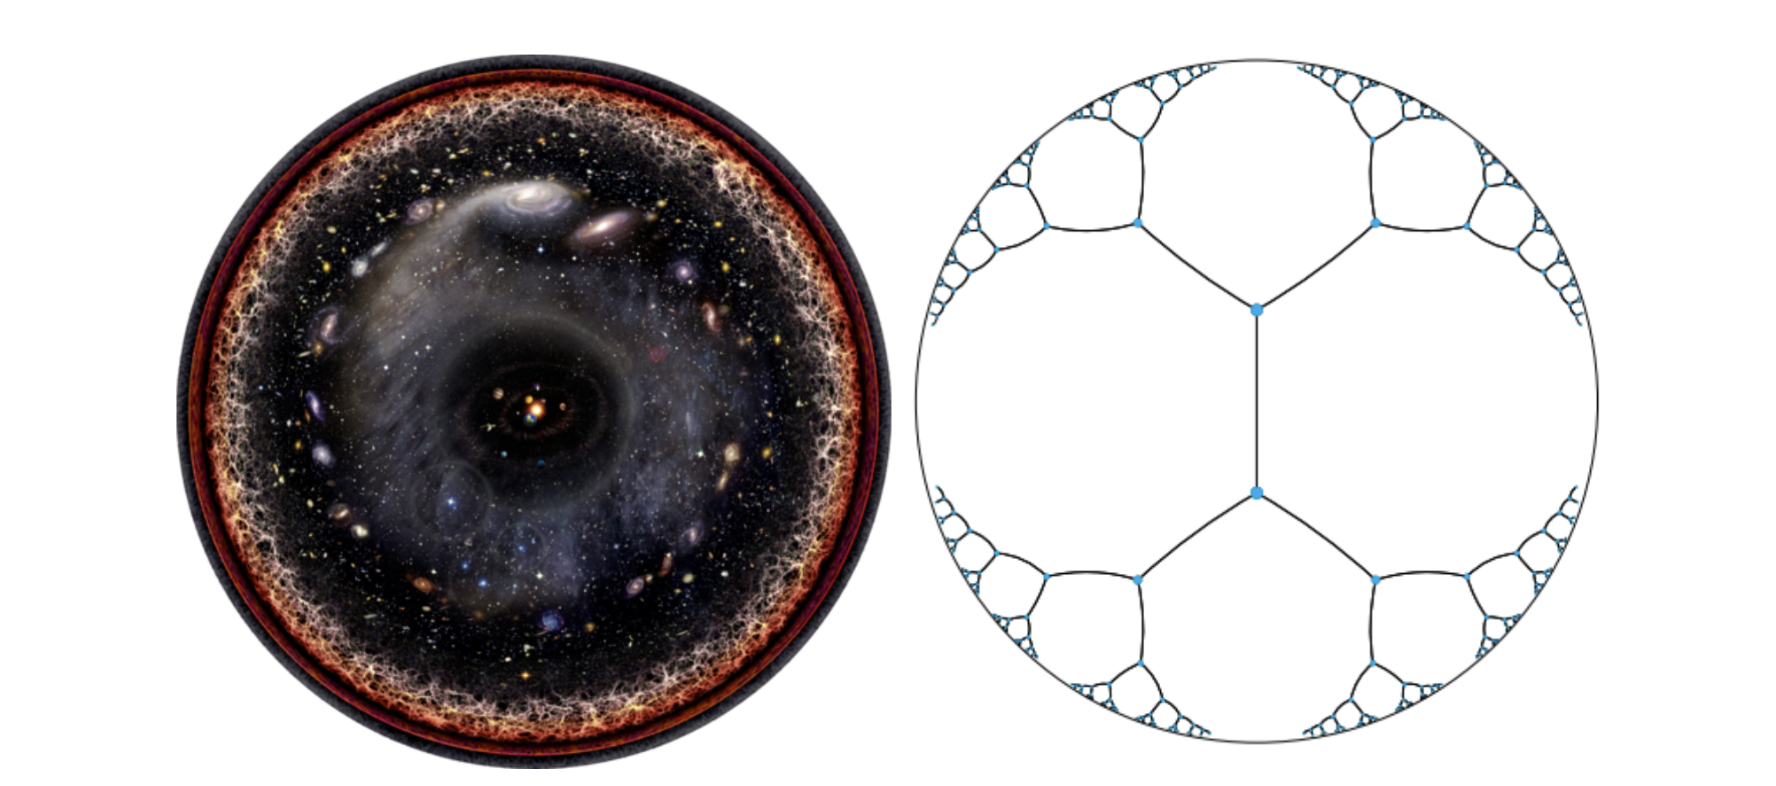
How do you fit the entire observable universe onto a single page? Place our solar system at the center, let each ring expand exponentially outward, and the cosmos compresses into a finite disc, as shown in the illustration above. That is hyperbolic geometry, a space where distance from the center unlocks exponentially more room; mathematicians formalized this idea in the Poincaré Ball shown above.
If this geometry can capture the entire universe, it can represent anything—including one of the most complex hierarchical datasets in biology, which describes protein functions organized across many levels, with each term deriving its meaning from its parent terms. Inspired by the CAFA-6 (Critical Assessment of Functional Annotation) [3] Kaggle Challenge, which involves predicting Gene Ontology terms (GO terms) from raw protein sequences, we would like to explain what makes this problem so complex. The central driver of complexity is the nature of Gene Ontology itself. GO is the standardized scientific reference for protein functions, a directed acyclic graph with over 45,000 terms that has been built up over decades to uniformly capture biological knowledge. Its structure makes standard ML unsuitable for four reasons:
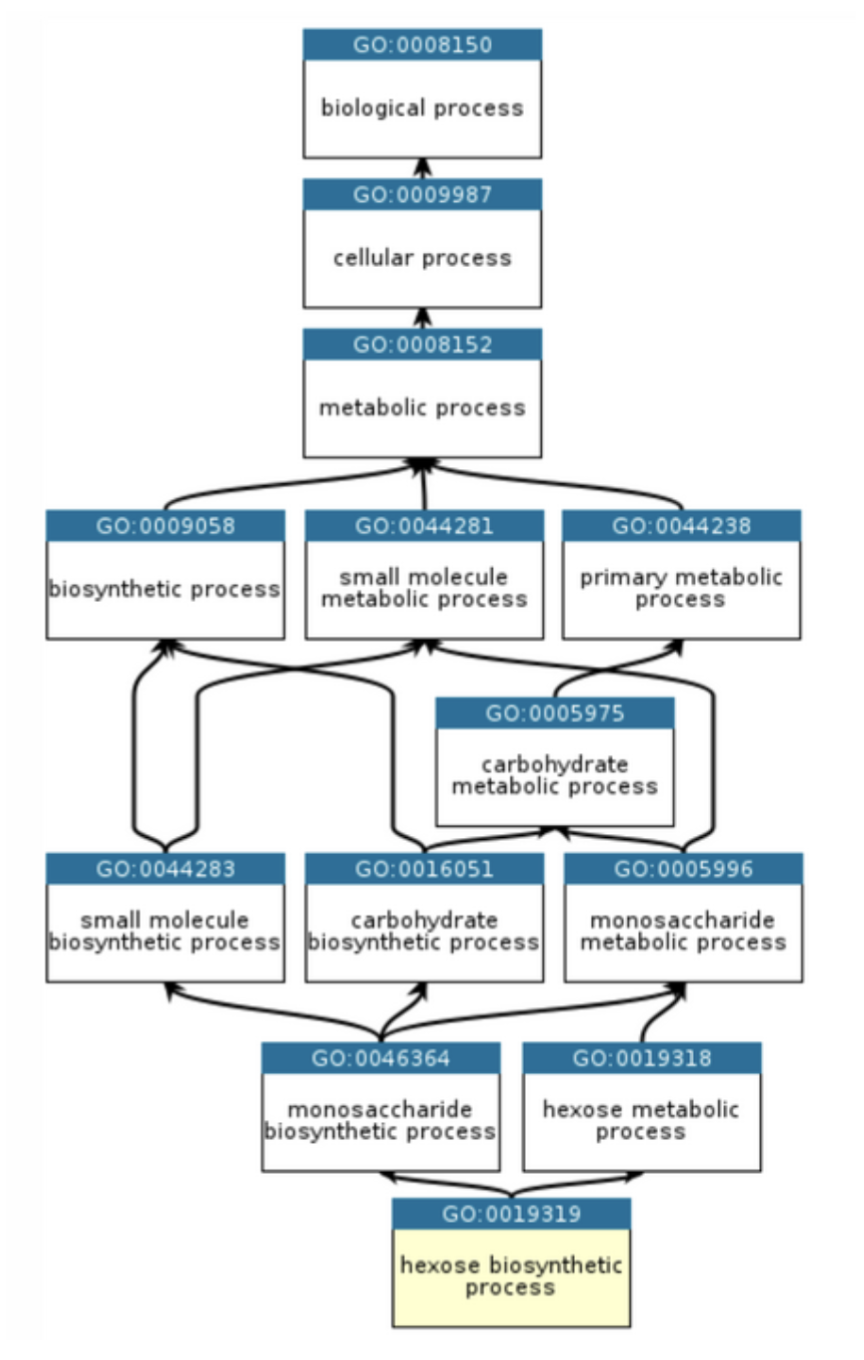
- First, GO is hierarchical with transitive closure. If you predict a specific term like "serine-type endopeptidase activity," you are implicitly claiming all ancestor terms are also true, and a model that gets the leaf right but the ancestors wrong is logically inconsistent.
- Second, 45,000+ terms with most proteins annotated with only a handful produces crippling class imbalance for any standard classifier.
- Third, and most subtle, is the fact that a missing label does not imply a negative. If a protein has no annotation for a given term, it could mean no one has tested it yet, not that the function is absent.
- Fourth, the labels are dynamic, new GO terms are created as biology advances. You are not fitting a fixed distribution. You are generalizing future scientific discoveries.
The first assumption we had to abandon to solve these challenges was Euclidean space. Flat geometry grows polynomially, a tree doubling its nodes at every level runs out of room fast, squeezing siblings together and collapsing hierarchical signals. Adding dimensions helps, but you end up needing hundreds, fighting the geometry rather than working with it. We are quite used to doing this, as scaling up parameters is easy, but we get no guarantees that the original hierarchical structure is adhered to.
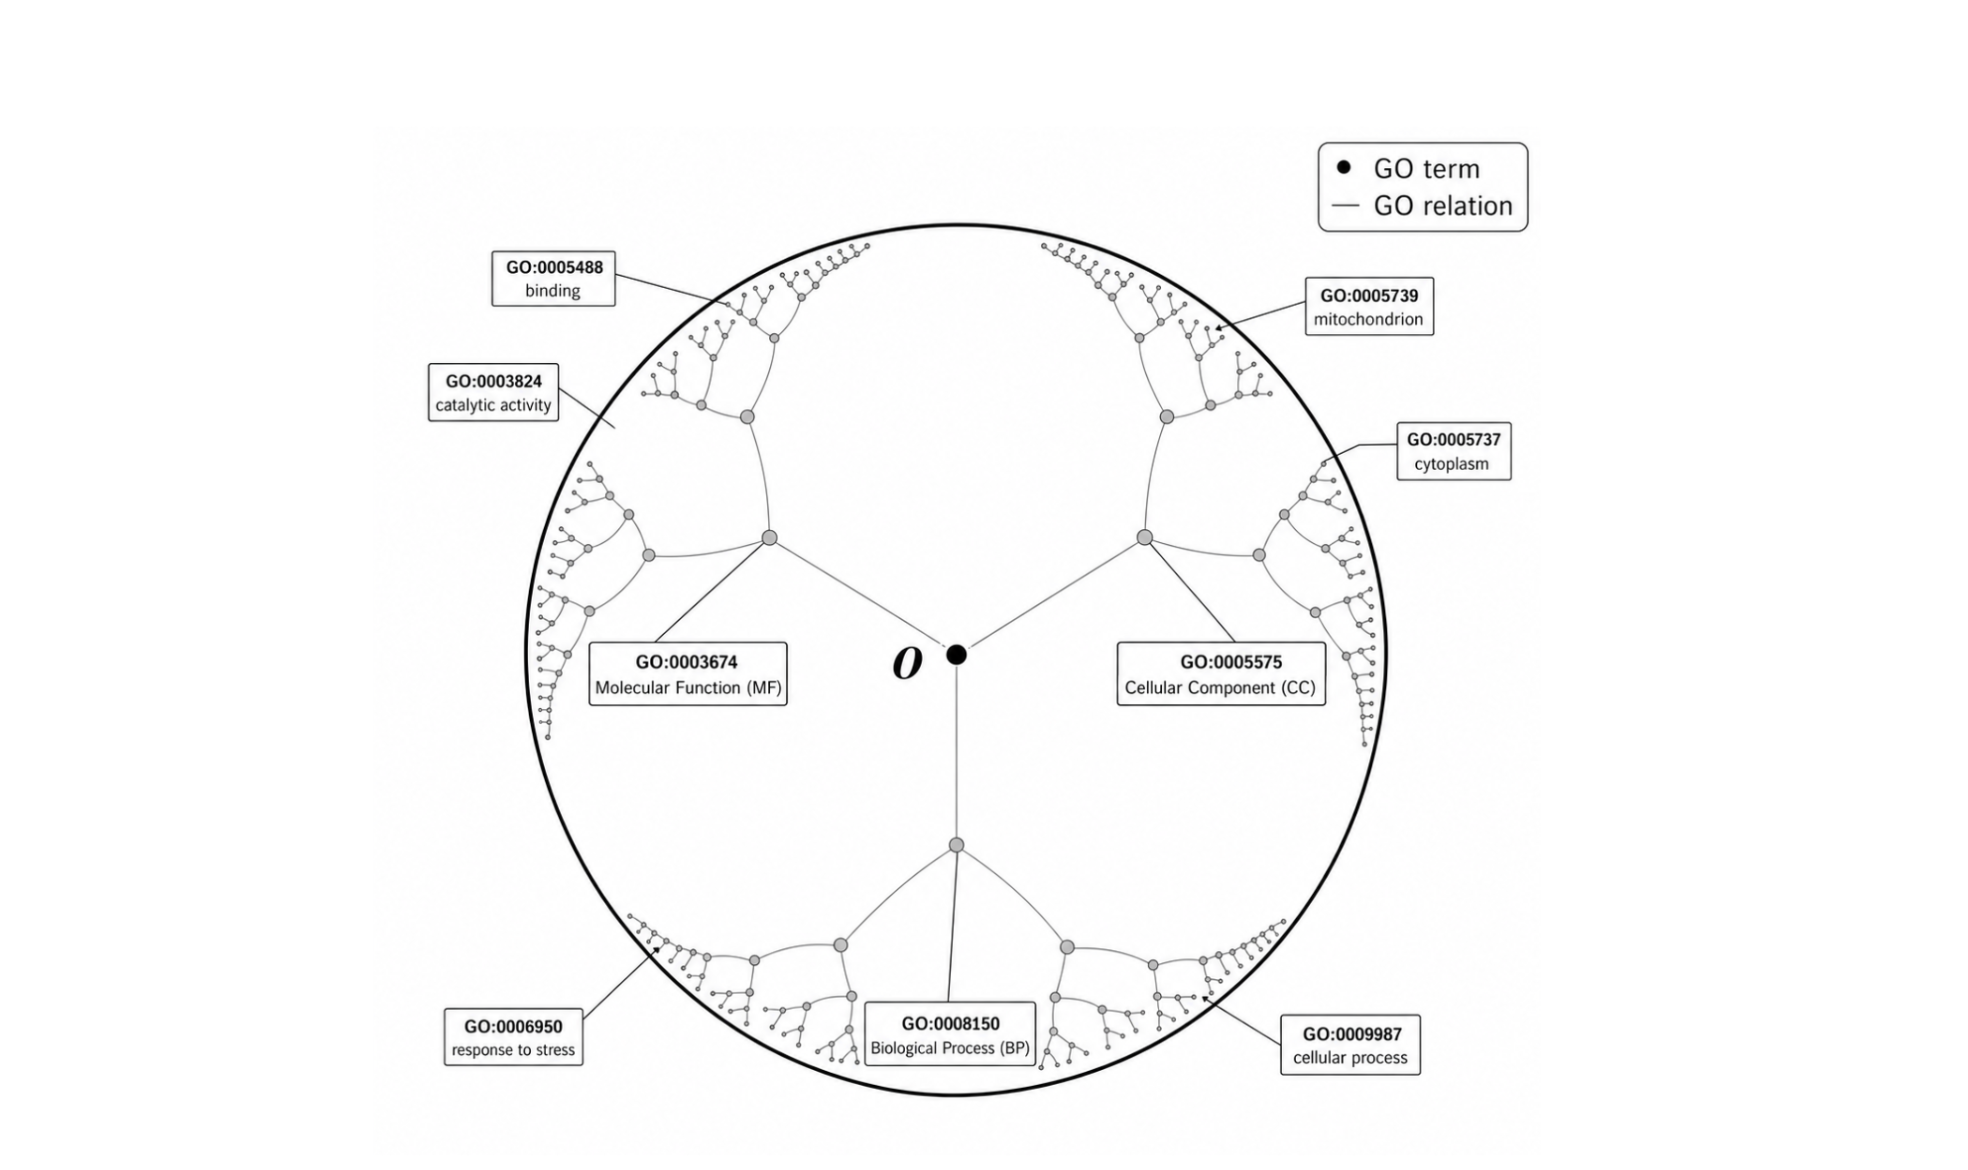
The solution was the Poincaré Ball mentioned above, a model of hyperbolic geometry where space expands exponentially outward. The GO root sits at the center, 45,000 leaf terms spread toward the boundary, all in 5–10 dimensions. The geometry encodes the hierarchy by construction. This serves as the central insight for solving the functional annotation problem.
Embedding the GO hierarchy into hyperbolic space solves the representational problem for our targets but a space is only useful if you can place things in it. So how to encode a protein such that its position in the Poincaré Ball actually reflects its function? For this we use three complementary signals: a protein's 3D structure, its evolutionary conservation across species, and the biological context of its homologs (we don't go into the details here). These streams are pooled and mapped into the Poincaré Ball through ontology-specific heads, producing representations aligned with the Gene Ontology structure. This brings us to the third problem of missing labels in the training data.
A conventional classifier treats every missing label as a true negative. In most domains that is a reasonable assumption. In proteomics it is not. If a protein has no annotation for a given GO term, it could mean no one has run the experiment yet, not that the function is absent. Penalizing a model for predicting unconfirmed-but-true GO terms is not just noisy; it is systematically wrong, and it gets worse the deeper into the ontology you go, where annotations are sparsest. Contrastive loss sidesteps this by changing what the model learns from. Instead of predicting against a fixed label set, it pulls proteins sharing GO terms together and pushes unrelated ones apart, while ignoring pairs that are close in the ontology, since proximity in the graph means relatedness, not contradiction. This means that once a protein is well-placed in hyperbolic space, function can be inferred simply by measuring distance to nearby GO terms.
Biological knowledge forced us to handle deep hierarchical structure and ambiguous labels. These are not exotic properties of genomics. Manufacturing has similar structures too, e.g., a Bill of Materials can run 10+ levels deep spanning from raw material to complete assembly. Fault taxonomies, supplier networks, product catalogs, regulatory compliance trees, all share the same underlying structure as GO and most are currently forced into flat embeddings that lose the hierarchical signal.
Biological data problems are often structurally identical to data problems in other domains. They are just dressed differently, and studied by people who rarely talk to the engineers building manufacturing systems. This series exists to make those connections explicit.
If you are working on hierarchical representation learning and/or in the field of molecular biology, reach out to us for a conversation or visit us at the AI Campus in Berlin!
Source
(1) Logarithmic illustration of the observable universe by Pablo Carlos Budassi, created for Wikipedia.org. Available at: https://commons.wikimedia.org/wiki/File:Observable_universe_logarithmic_illustration.png
(2) Nickel, Maximillian, and Douwe Kiela. “Poincaré embeddings for learning hierarchical representations.” Advances in Neural Information Processing Systems 30 (2017).
(3) https://www.kaggle.com/competitions/cafa-6-protein-function-prediction
(4) https://geneontology.org/docs/ontology-documentation/
Subscribe to the Merantix Momentum Newsletter now.
More articles
.png)
.png)
.png)
.png)
When biology forces better AI: What protein function prediction taught us about hierarchical data
By Glenn Kroegel, Senior Machine Learning Engineer
How do you fit the entire observable universe onto a single page? Place our solar system at the center, let each ring expand exponentially outward, and the cosmos compresses into a finite disc, as shown in the illustration above. That is hyperbolic geometry, a space where distance from the center unlocks exponentially more room; mathematicians formalized this idea in the Poincaré Ball shown above.
If this geometry can capture the entire universe, it can represent anything—including one of the most complex hierarchical datasets in biology, which describes protein functions organized across many levels, with each term deriving its meaning from its parent terms. Inspired by the CAFA-6 (Critical Assessment of Functional Annotation) [3] Kaggle Challenge, which involves predicting Gene Ontology terms (GO terms) from raw protein sequences, we would like to explain what makes this problem so complex. The central driver of complexity is the nature of Gene Ontology itself. GO is the standardized scientific reference for protein functions, a directed acyclic graph with over 45,000 terms that has been built up over decades to uniformly capture biological knowledge. Its structure makes standard ML unsuitable for four reasons:
- First, GO is hierarchical with transitive closure. If you predict a specific term like "serine-type endopeptidase activity," you are implicitly claiming all ancestor terms are also true, and a model that gets the leaf right but the ancestors wrong is logically inconsistent.
- Second, 45,000+ terms with most proteins annotated with only a handful produces crippling class imbalance for any standard classifier.
- Third, and most subtle, is the fact that a missing label does not imply a negative. If a protein has no annotation for a given term, it could mean no one has tested it yet, not that the function is absent.
- Fourth, the labels are dynamic, new GO terms are created as biology advances. You are not fitting a fixed distribution. You are generalizing future scientific discoveries.
The first assumption we had to abandon to solve these challenges was Euclidean space. Flat geometry grows polynomially, a tree doubling its nodes at every level runs out of room fast, squeezing siblings together and collapsing hierarchical signals. Adding dimensions helps, but you end up needing hundreds, fighting the geometry rather than working with it. We are quite used to doing this, as scaling up parameters is easy, but we get no guarantees that the original hierarchical structure is adhered to.
The solution was the Poincaré Ball mentioned above, a model of hyperbolic geometry where space expands exponentially outward. The GO root sits at the center, 45,000 leaf terms spread toward the boundary, all in 5–10 dimensions. The geometry encodes the hierarchy by construction. This serves as the central insight for solving the functional annotation problem.
Embedding the GO hierarchy into hyperbolic space solves the representational problem for our targets but a space is only useful if you can place things in it. So how to encode a protein such that its position in the Poincaré Ball actually reflects its function? For this we use three complementary signals: a protein's 3D structure, its evolutionary conservation across species, and the biological context of its homologs (we don't go into the details here). These streams are pooled and mapped into the Poincaré Ball through ontology-specific heads, producing representations aligned with the Gene Ontology structure. This brings us to the third problem of missing labels in the training data.
A conventional classifier treats every missing label as a true negative. In most domains that is a reasonable assumption. In proteomics it is not. If a protein has no annotation for a given GO term, it could mean no one has run the experiment yet, not that the function is absent. Penalizing a model for predicting unconfirmed-but-true GO terms is not just noisy; it is systematically wrong, and it gets worse the deeper into the ontology you go, where annotations are sparsest. Contrastive loss sidesteps this by changing what the model learns from. Instead of predicting against a fixed label set, it pulls proteins sharing GO terms together and pushes unrelated ones apart, while ignoring pairs that are close in the ontology, since proximity in the graph means relatedness, not contradiction. This means that once a protein is well-placed in hyperbolic space, function can be inferred simply by measuring distance to nearby GO terms.
Biological knowledge forced us to handle deep hierarchical structure and ambiguous labels. These are not exotic properties of genomics. Manufacturing has similar structures too, e.g., a Bill of Materials can run 10+ levels deep spanning from raw material to complete assembly. Fault taxonomies, supplier networks, product catalogs, regulatory compliance trees, all share the same underlying structure as GO and most are currently forced into flat embeddings that lose the hierarchical signal.
Biological data problems are often structurally identical to data problems in other domains. They are just dressed differently, and studied by people who rarely talk to the engineers building manufacturing systems. This series exists to make those connections explicit.
If you are working on hierarchical representation learning and/or in the field of molecular biology, reach out to us for a conversation or visit us at the AI Campus in Berlin!
Source
(1) Logarithmic illustration of the observable universe by Pablo Carlos Budassi, created for Wikipedia.org. Available at: https://commons.wikimedia.org/wiki/File:Observable_universe_logarithmic_illustration.png
(2) Nickel, Maximillian, and Douwe Kiela. “Poincaré embeddings for learning hierarchical representations.” Advances in Neural Information Processing Systems 30 (2017).
(3) https://www.kaggle.com/competitions/cafa-6-protein-function-prediction
(4) https://geneontology.org/docs/ontology-documentation/

.png)
.png)
